Application study · Customer evaluation project
Track the movement. Make small vibrations visible.
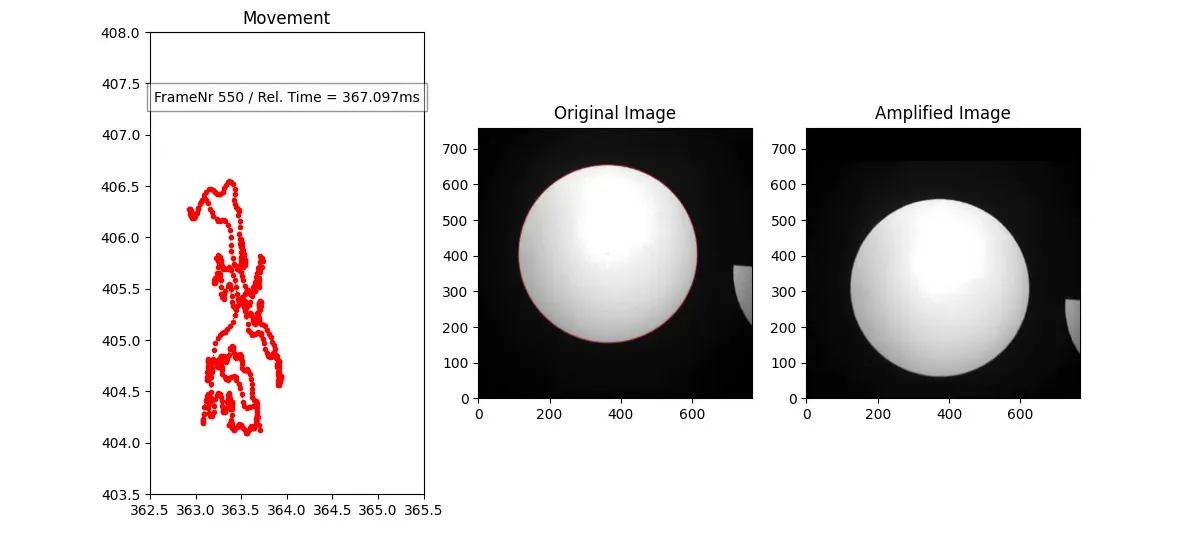
As part of a customer evaluation, HSCAM implemented marker-based motion tracking and motion amplification using STREAMER high-speed recordings. The analysis visualizes the marker’s trajectory and displays amplified motion alongside the original image.
The situation
On a vibrating machine, the path matters, not only the movement
On machines that vibrate, such as screens and exciters, it is not enough to know that something moves. How it moves also matters: the path it follows and how that path deviates over time. A visual analysis of high-speed recordings can help to examine movement paths and deviations.
The customer evaluation set out to examine, as project requirements at the time:
- Vibration amplitude
- Frequency
- Movement path (trajectory)
- Phase relationships between several measurement points
The analysis video shows what was implemented: marker tracking, the motion trajectory and marker-based motion amplification.
Analysis video
Trajectory, original and amplified image side by side
A prepared analysis of one test recording, showing three views side by side.
Vibration analysis: marker tracking and motion amplification
- Camera
- HSCAM STREAMER 1M13
- Acquisition rate
- 1,500 fps
- Image size
- 768 × 760 px
- Analysis
- Marker tracking, motion trajectory, motion amplification
Acquired at 1,500 fps and prepared as an analysis video.
On a phone, open the video in full screen (button in the player) to read the chart labels.
- Movement
- The tracked marker position plotted as a motion trajectory.
- Original Image
- The recorded marker image, shown as the reference for comparison.
- Amplified Image
- Marker-based motion amplification makes small movements easier to see.
Motion amplification is a visualization of the measured image motion; it does not by itself increase measurement accuracy.
Test setup
What the example shows
- High-speed recording of a circular marker.
- The marker’s position is determined across the image sequence, with sub-pixel resolution.
- The movement path is displayed as a trajectory.
- Original and amplified motion are compared side by side.
The evaluation targeted vibrating screens and exciters. The example shown here uses a separate test recording with non-periodic motion to demonstrate tracking and motion amplification.
The machine type the evaluation targeted: a vibrating screen
Video provided by the customer. It shows the type of machine the evaluation targeted.
Implemented
Three results from this study
Implemented marker-based motion amplification is a working function. It acts on a tracked marker.
A
Marker tracking
Track the marker’s position across successive high-speed frames with sub-pixel resolution: the trajectory is given in fractions of a pixel.
B
Motion trajectory
Visualize the movement path rather than relying on visual inspection of the original recording alone.
C
Motion amplification
Display computationally amplified motion beside the original image to make small movements easier to inspect.
The movement shown spans only a few pixels of the 768 × 760 image, which is why sub-pixel position values matter.
Possible further uses
Where a similar approach could be examined
Possible transfers of this approach.
- Vibrating screens
- Vibratory feeders
- Mechanical test rigs
- Moving machine components
Predictive maintenance
Motion analysis can support predictive maintenance: the movement path of a machine component, recorded at intervals, can be compared over time to see whether its movement changes. This The aim of predictive maintenance is to reduce the cost of exchanging parts: components are replaced when their movement indicates wear, not on fixed intervals or after a failure. This study demonstrates the tracking and visualization this relies on.
What is checked for your setup
- Optical access
- Marker visibility and attachment
- Field of view and working distance
- Lighting and exposure
- Required temporal resolution
- Calibration, if physical displacement measurements are required
The 1,500 fps belong to the test shown here. The frame rate a different application needs depends on the movement and is worked out together.
Want to inspect a vibration or movement in your own setup?
Discuss your vibration measurement
Describe which component moves and what is hard to see or measure. Technical values can follow later; unknown values do not stop an enquiry.
Helpful, but not required
- Which component moves?
- What is difficult to see or measure?
- Approximate frequency or speed, if known
- Approximate movement range, if known
- Available optical access
contact@hscam.com · hscam.com